| JSCE Paper Award 2015 | ||
| Establishment of Coupled Analysis of Interaction between Structural Deterioration and Reinforcement Corrosion by Salt Damage | ||
| PDF Version | ||
|
Mika SUZUKI | Taisei Corporation |
| Naoyuki FUKUURA | Taisei Corporation | |
| Tsuyoshi MARUYA | Taisei Corporation | |
| T he limit state of durability verification of a reinforced concrete (RC) structure should be corrosion cracking, not the onset of steel corrosion in concrete. It is becoming increasingly important to predict the structural performance of RC structures after the onset of corrosion-induced cracking on a long-term basis. That is, an analysis method that can predict structural performance is required. | |||
| We developed a coupled analysis of the interaction between structural deterioration and reinforcement corrosion by salt damage (Figure 1). Nonlinear structural analysis of the RC member is used for structural deterioration. The chloride ion diffusion model and a model of micro-cell and macro-cell corrosion are used for the reinforcement corrosion. For reinforcement corrosion, we incorporated the distribution of macro-cell corrosion current density. | |||
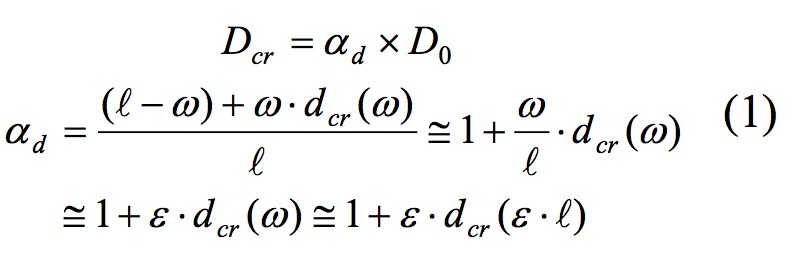
| The chloride ion diffusion model for cracked concrete is set up according to Djerbi’s method. If a single crack occurs in one element and the width of the crack is obtained by multiplying the tensile strain by the average crack width, then the diffusion coefficient for the finite element can be calculated as shown in Equation (1). | |||
|
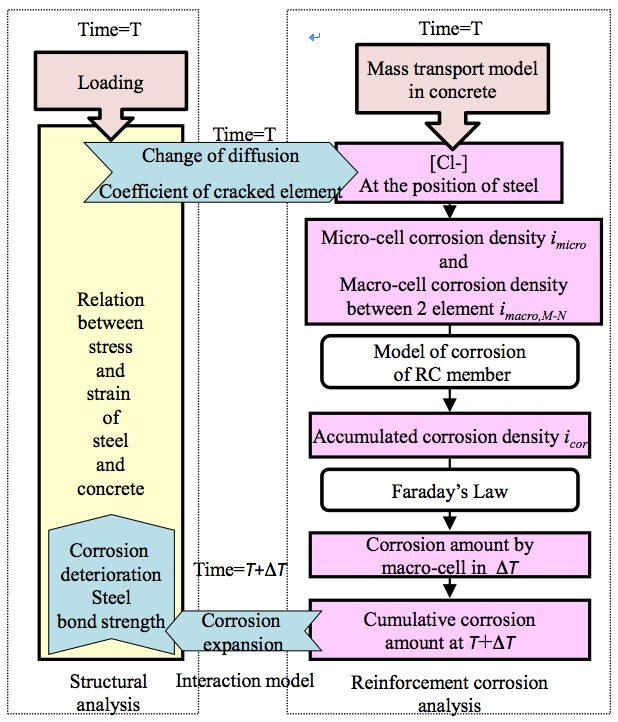 Figure 1. Flow diagram of coupled analysis |
||
|
The macro-cell corrosion is calculated using internal polarization curves and external polarization curves. The macro-cell corrosion between two elements (element M, N) of steel in concrete is shown in Figure 3 under the condition that the area of the anodal element equals the area of the cathodal element. |
|||
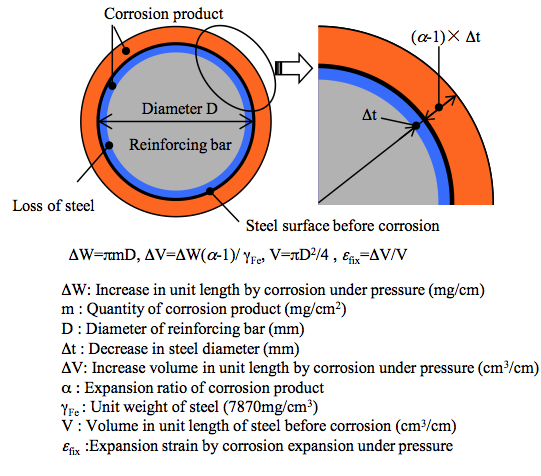 Figure 2. Model of corrosion expansion |
 Figure 3. Macro-cell corrosion between two elements (element M, N) of steel in concrete |
||
| Current density ig,M―N at that time is the current density when the potential difference between the external cathodal polarization curve (iapp,c,M,Ec) and the external anodal polarization curve (iapp,a,N,Ea) is equal to the potential difference ΔEM-N of the concrete resistance between element M and element N (Equation 2). | |||
 |
|||
|
When a reinforcing bar is modelled with a plural divisional element, the influence of the ratio of the cathodal area and the anodal area is considered. The distribution diagram of macro-cell corrosion current density β is set, and a macro-cell corrosion current between the cathode and each anti-anode from a certain cathodal element is distributed into each anti-anodal element.
|
|||
|
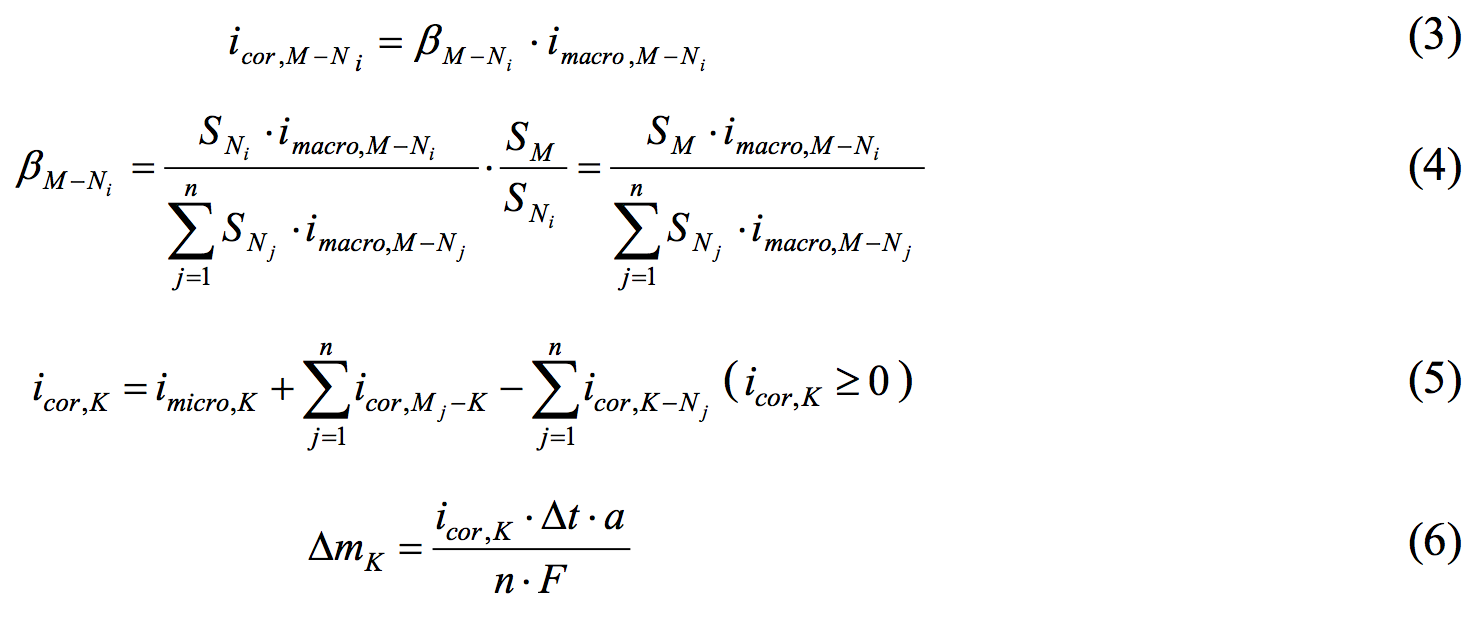
The macro-cell corrosion current density of a certain anodal element (Ni), when n unit anodal elements exist for a certain cathodal element (M), is shown in Equation (3). The distribution diagram βM-Ni is set by Equation (4). The introduction of such a distribution diagram is not strictly expressed the distribution of the macro-cell corrosion current density, which occurs between plural elements in a real situation. It was thought that the model adjusts to the real situation, such as a higher chloride ion concentration of the anodal part, a closer distance between the cathodal part and anodal part, a bigger cathodal area or a smaller anodal area, or a larger quantity of corrosion product per unit area.
|
|||
|
All of the corrosion current densities in element K of the steel in an RC member are illustrated in Figure 4 and calculated using Equation (5). The corrosion current density is the micro-cell corrosion All of the corrosion current densities in element K of the steel in an RC member are illustrated in Figure 4 and calculated using Equation (5). The corrosion current density is the micro-cell corrosion current density imicro,K plus the macro-cell corrosion current density between element K and the other elements when element K is the anodal element, minus the macro-cell corrosion current density between element K and the other elements when element K is the cathodal element. The time increment of the corrosion quantity of element K, which is shown in Equation (6), is calculated using Faraday’s law. |
|||
 |
|||
| where icor,M-Ni is the macro-cell corrosion current density between element M and element Ni of the steel in the RC member (A/cm2), βM-Ni is the distribution diagram of the macro-cell corrosion current density between element M and Ni, SM is the surface area of element M (cathodal part)(cm2), SN is the surface area of element N (anodal part)(cm2), icor,K is the total corrosion current density of element K (A/cm2) ,ΔmK is the time increment of the corrosion quantity of element K(g/cm2), Δ t is the time increment(s), a is the atomic weight of iron (55.845), n is the equivalent of dissolved iron ion (2 mol eq), and F is the Faraday constant (96500 C/mol eq). | |||
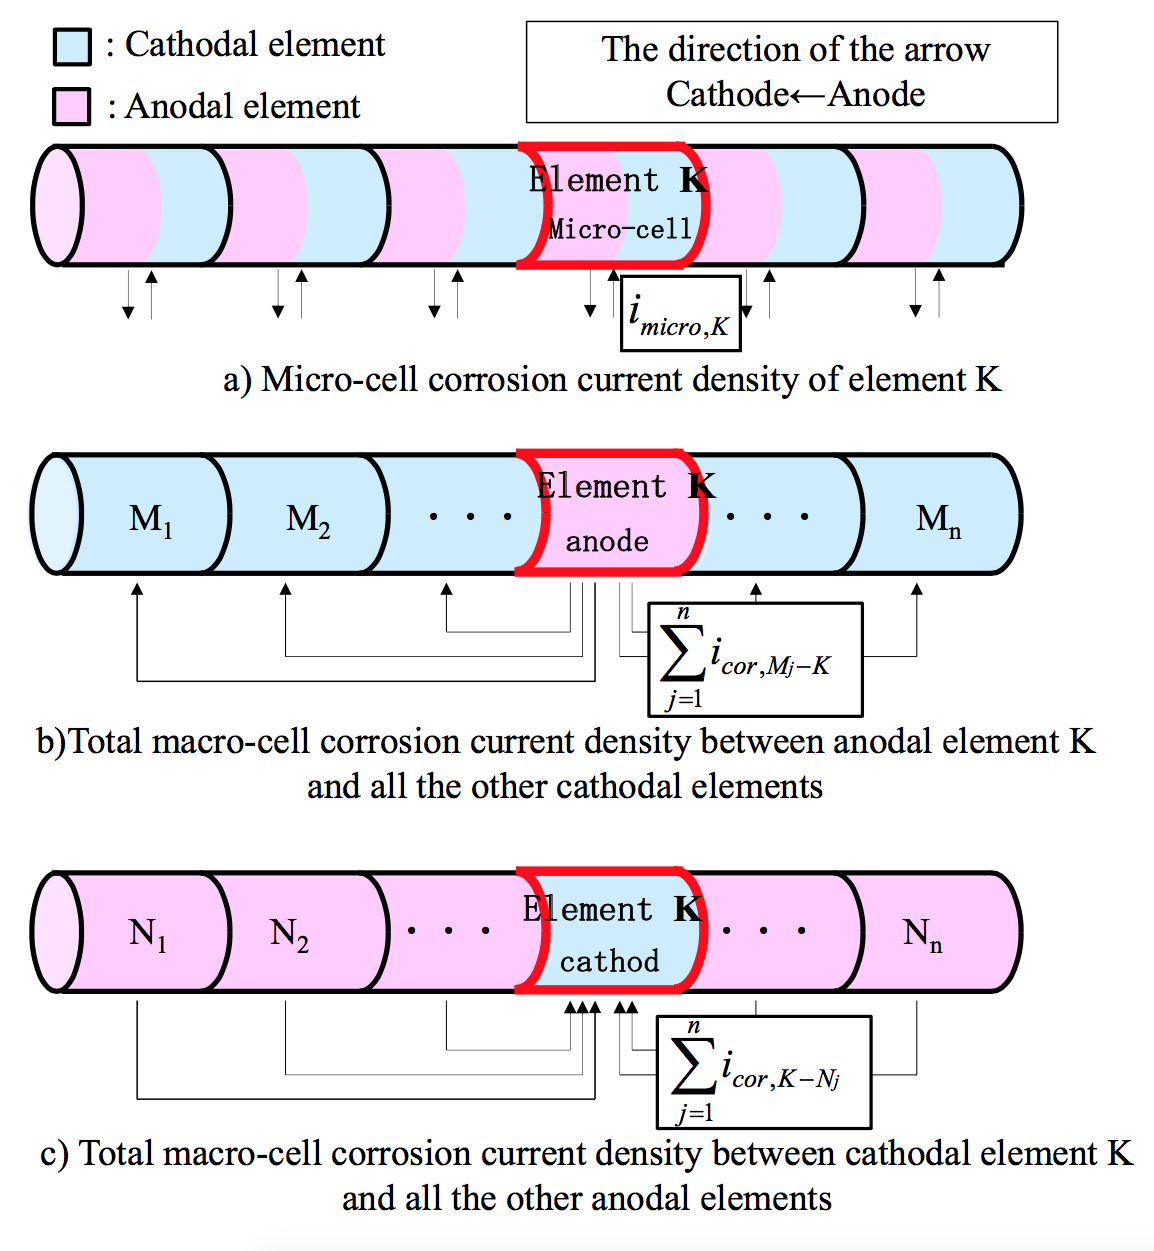 Figure 4. All corrosion current densities in element K of steel in an RC member |
|||
|
The proposed analytical method is validated through dry-wet cyclic tests with a salt solution to simulate macro-cell corrosion due to an inspection of the corrosion amount after corrosion cracking. The experimental setup of the specimens is illustrated in Figure 5. Table 1 shows the FEM analysis cases. Figure 6 shows the 1/2-scale model used for analysis, which was adopted in consideration of the sectional symmetry and exposure conditions. The proportional increase in the diffusion coefficient of D0 in the cracked part, dcr, was set according to Model 1 and Model 2 (Figure 7). |
|||
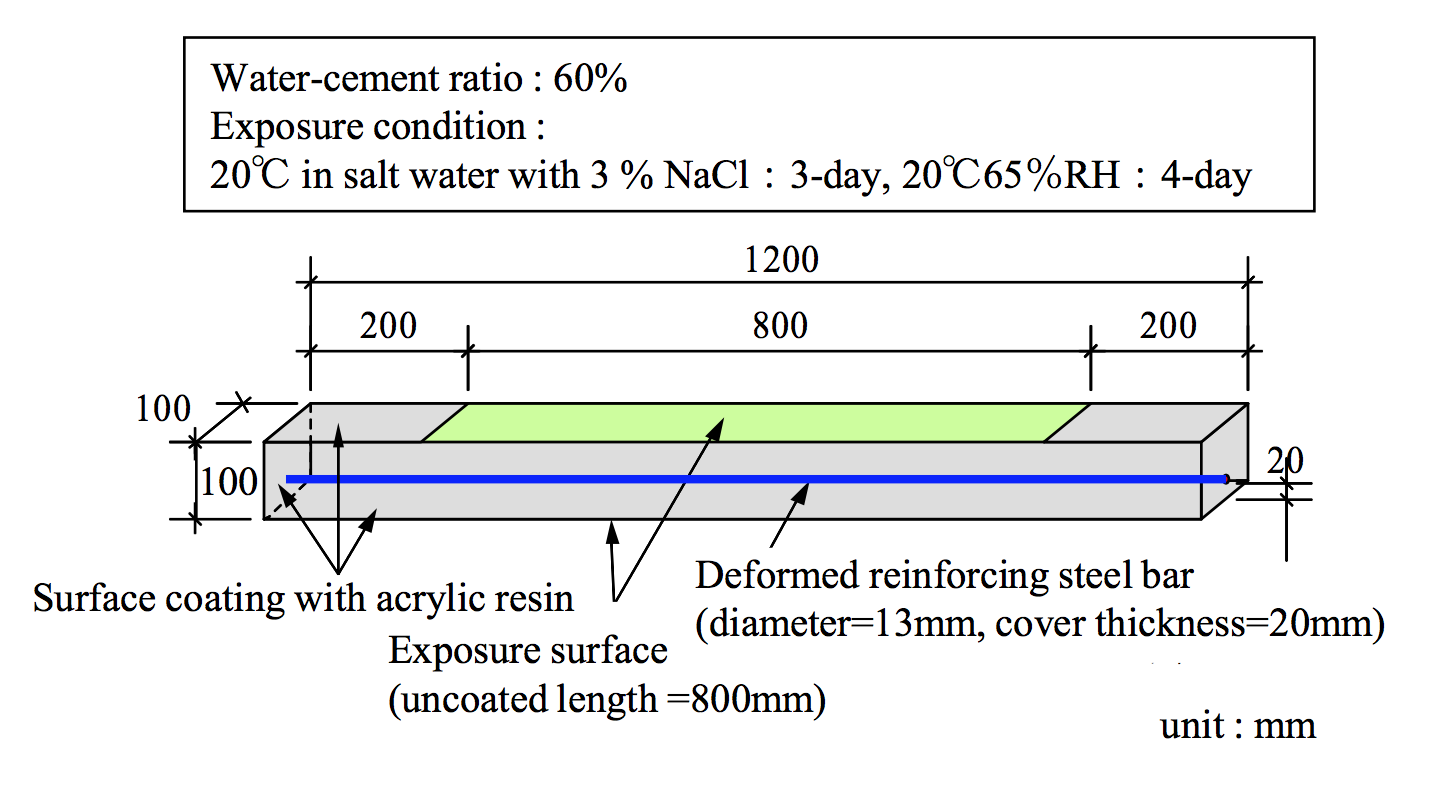 Figure 5. Overview of experiment |
|||
Table 1. Analysis cases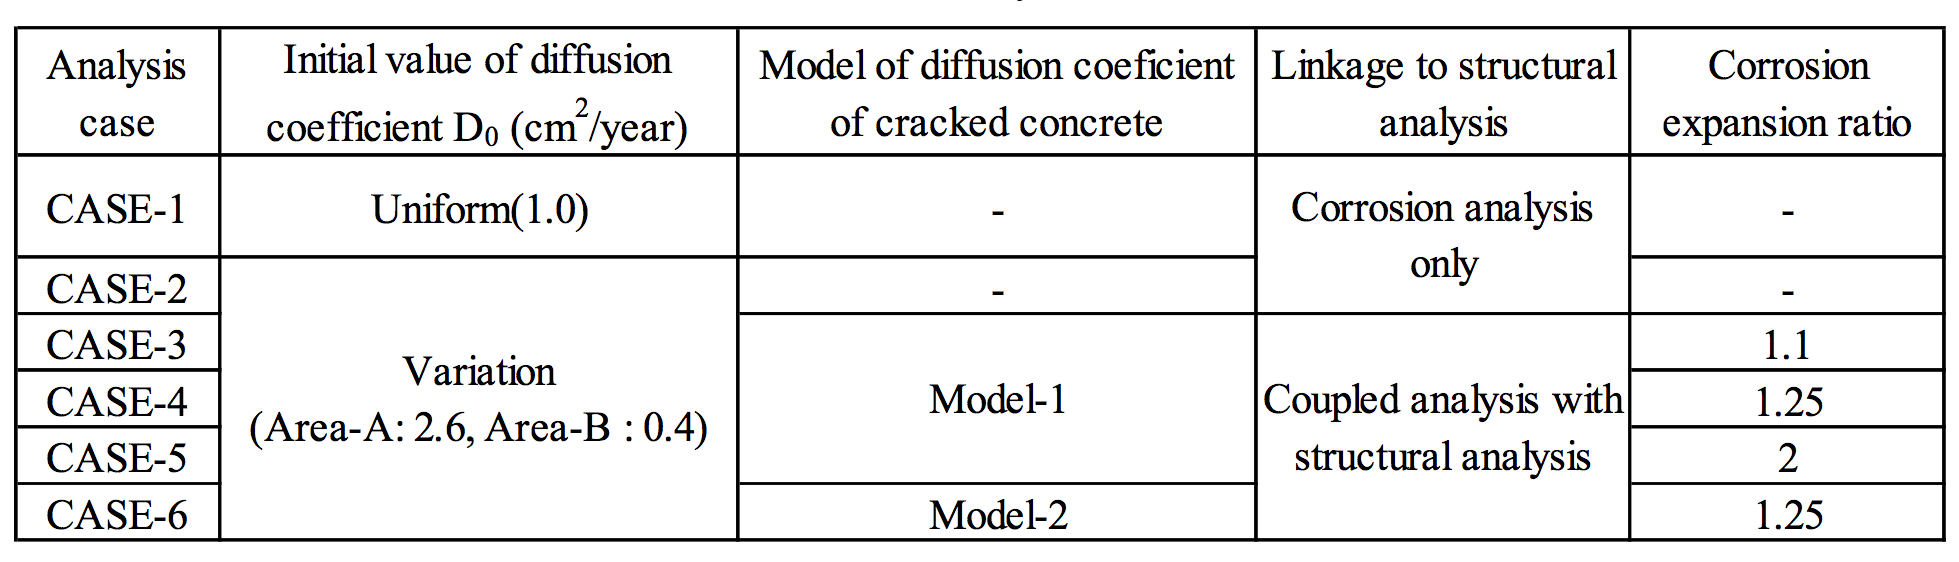 |
|||
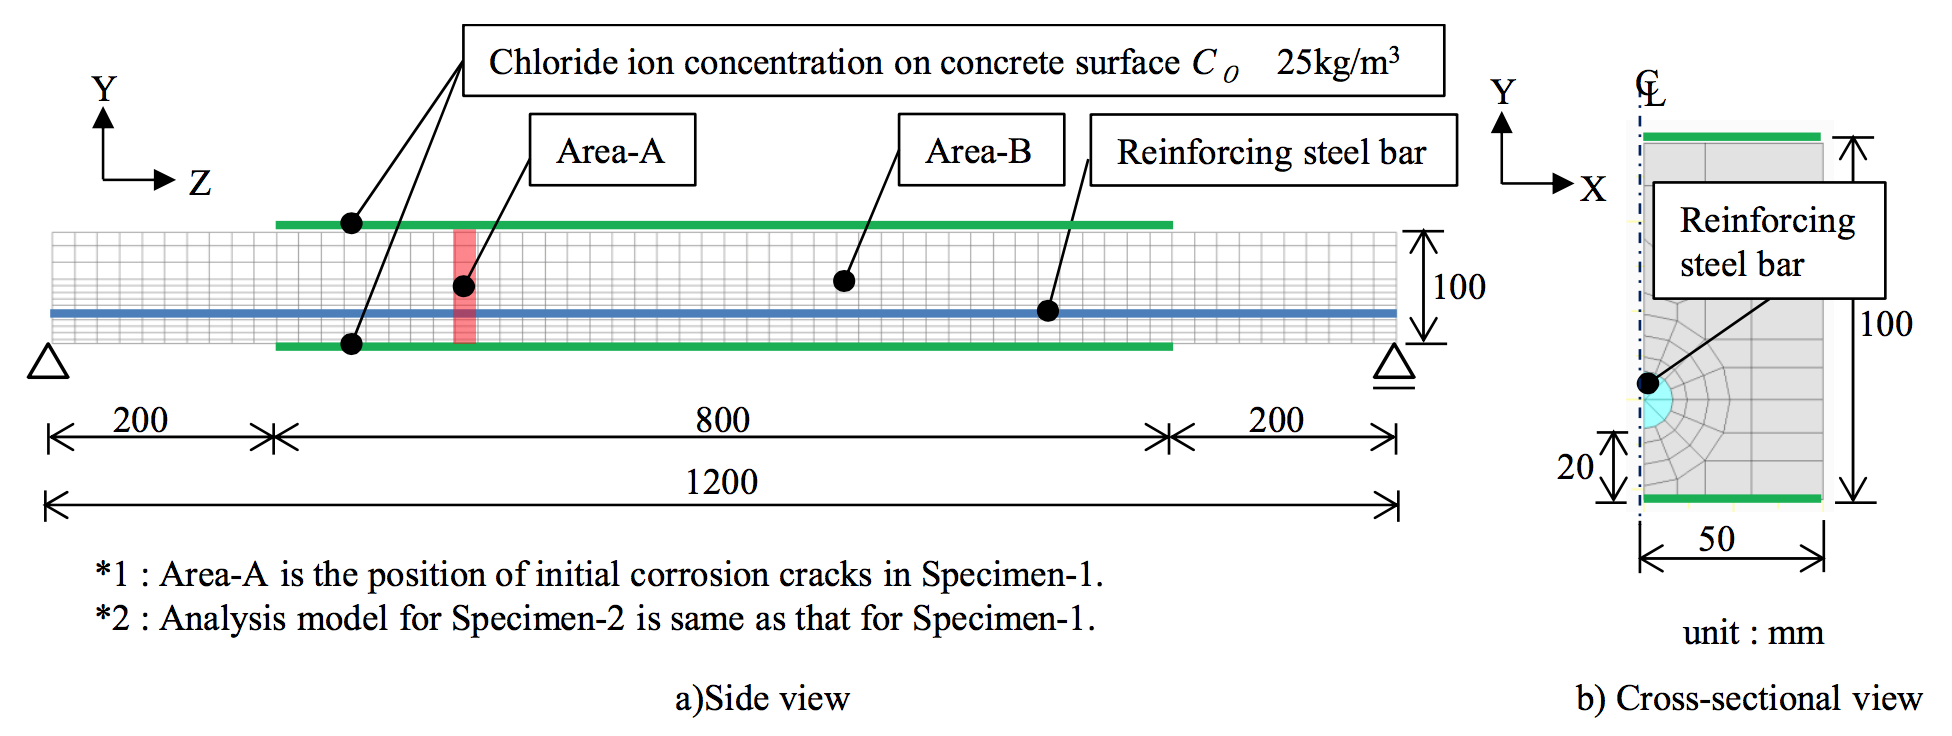 Figure 6. Analysis model |
|||
|
Figure 8 compares the chloride ion concentration in the experiment and analysis. For Specimen 2, the position of the analysis was adjusted by 100 mm to match the position of the corrosion cracks in the experiment with Area A in the analysis in Figure 6. Cases 2 to 6, which considered the non-homogeneity of initial diffusion coefficient D0, reproduced the experimental trend.
|
|||
|
Figure 9 compares the amount of corrosion in the experiment and the analysis. The area of increased chloride ion concentration that was extended due to the onset of corrosion cracking in Cases 3 to 5, which are the coupled-analysis cases using Model 1 for the diffusion coefficient of the cracked concrete. The anode area of the macro-cell corrosion and the corrosion area also expanded. The analysis results agree to the experimental trend.
|
|||
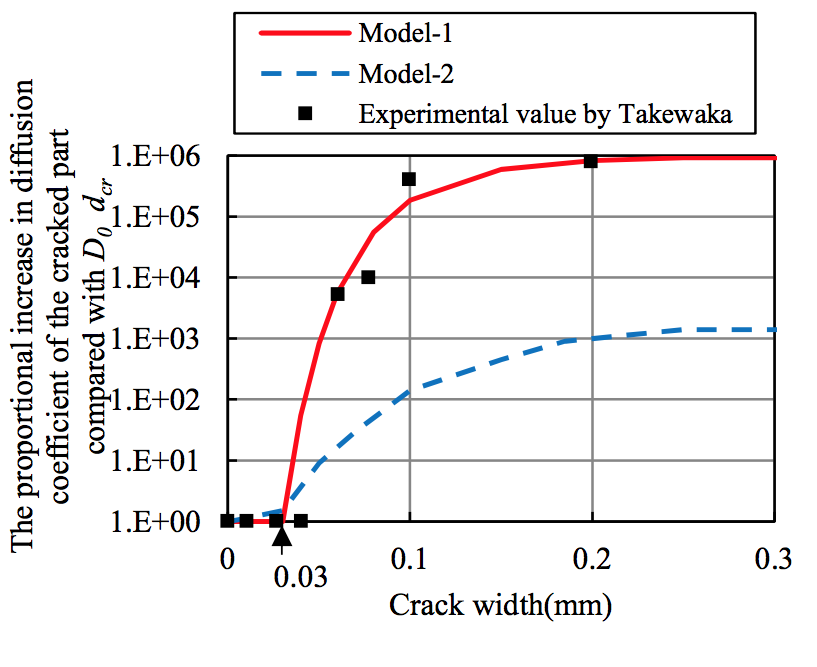 Figure 7. Proportional increase in the diffusion coefficient of the cracked part |
|||
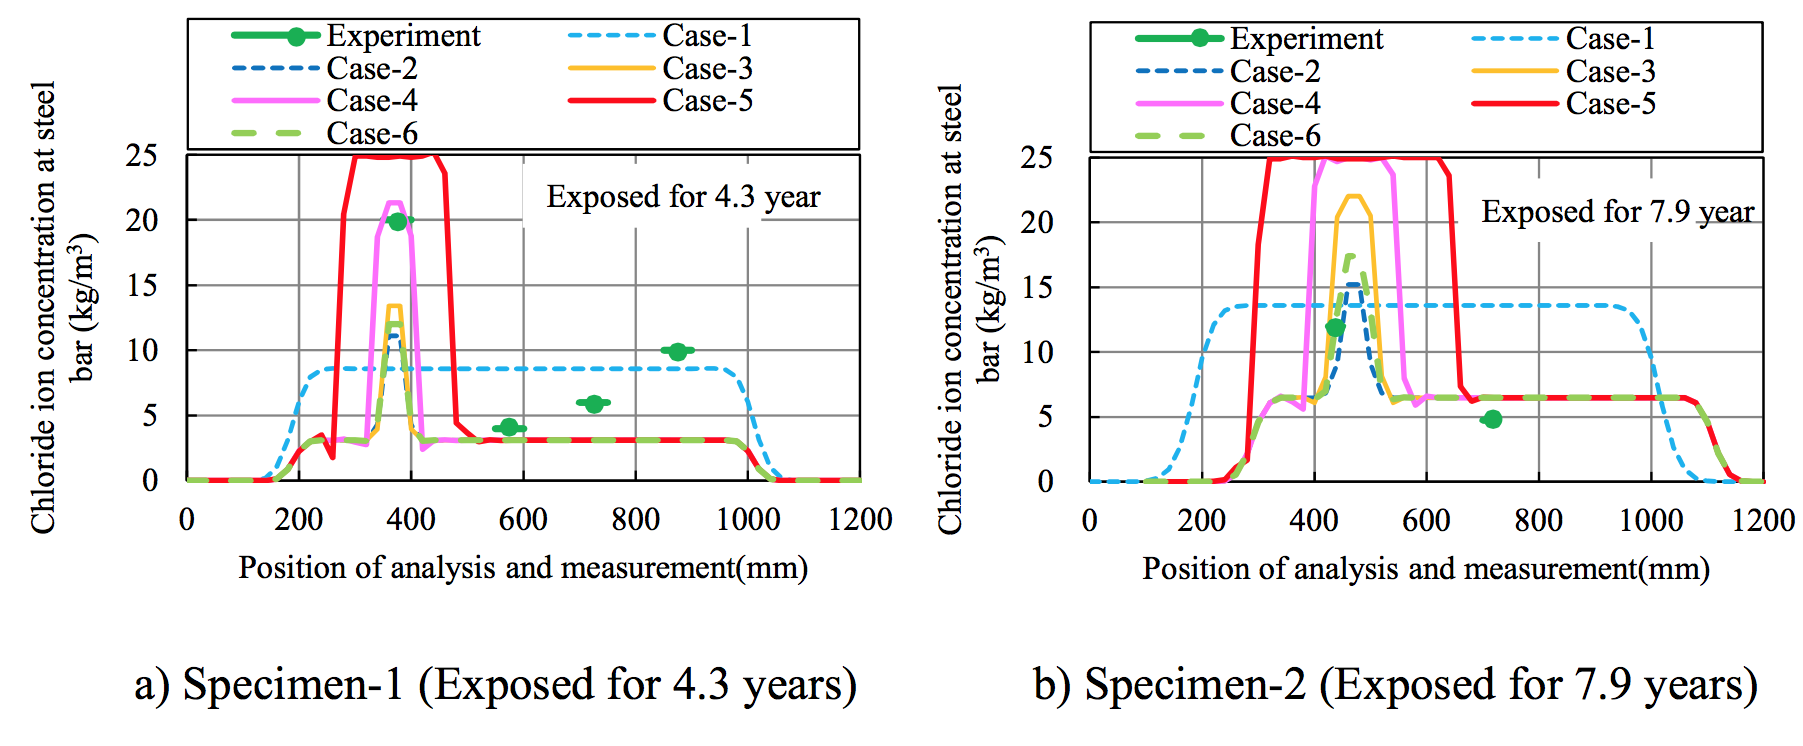 Figure 8. Comparison of chloride concentrations in experiment and analysis |
|||
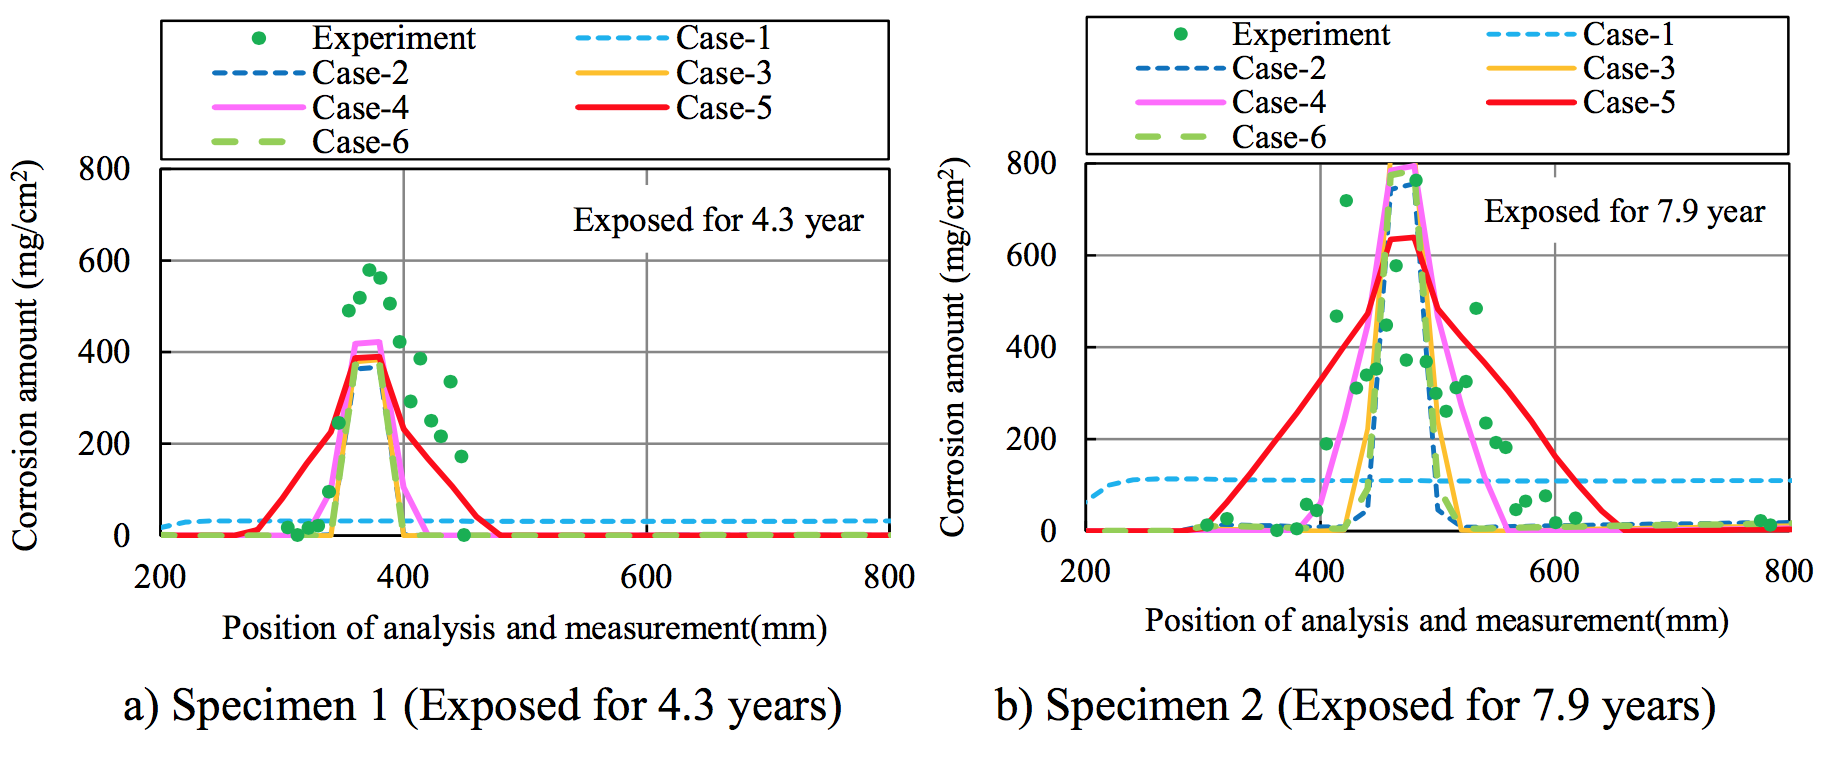 Figure 9. Amounts of corrosion in experiment and analysis |
|||