


Kenta TAKEDA (Nagaoka University of Technology), Yasushi TANAKA (The University of Tokyo), Takumi SHIMOMURA (Nagaoka University of Technology), Takayuki YAMAGUCHI (Nagaoka University of Technology), Suguru KUGA (Yachiyo Engineering Co., Ltd.), Kou IBAYASHI (Nagaoka University of Technology) and Yuki MURAKAMI (National Institute of Technology, Nagaoka College)
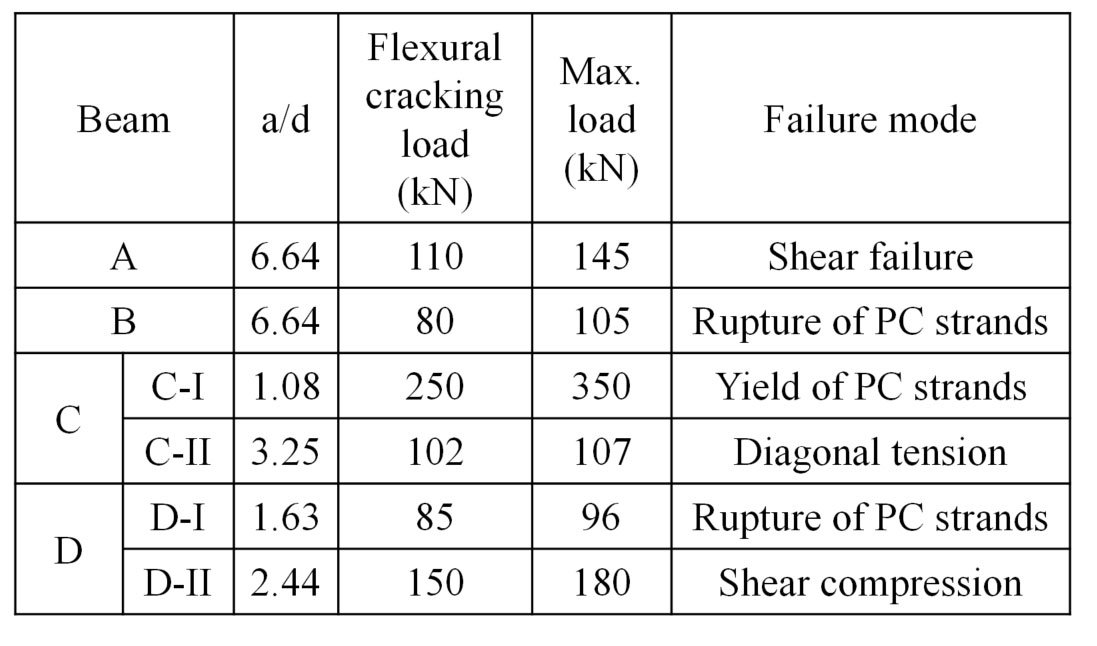
We conducted loading tests of deteriorated pre-tensioned prestressed concrete (PC) girders that had been in service for about 35 years near the Japan Sea (Figure 1). Two of the four girders (beams A and B) were tested in flexure and the other two (beams C and D) were tested in flexural shear (Figure 2). Four-point loading was adopted for the flexural tests and asymmetric three-point loading for flexural shear tests. Table 1 shows a summary of the results of these loading tests. In the flexural shear tests, shear span (a) to effective depth (d) ratio (a/d) was selected as the test factor. The results in Table 1 show that failure mode and structural performance were different in each case because the distribution of corrosion of the prestressing strands was different in each girder..
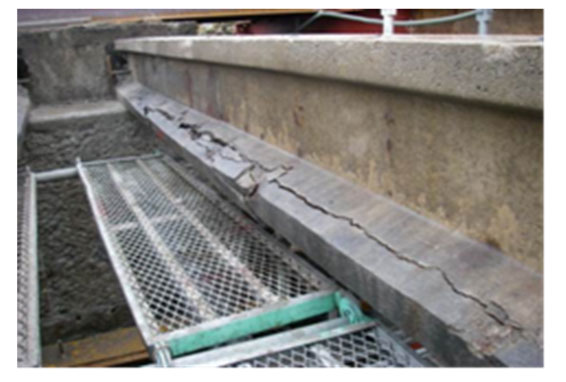
Figure 1: Deteriorated PC girder (beam D)
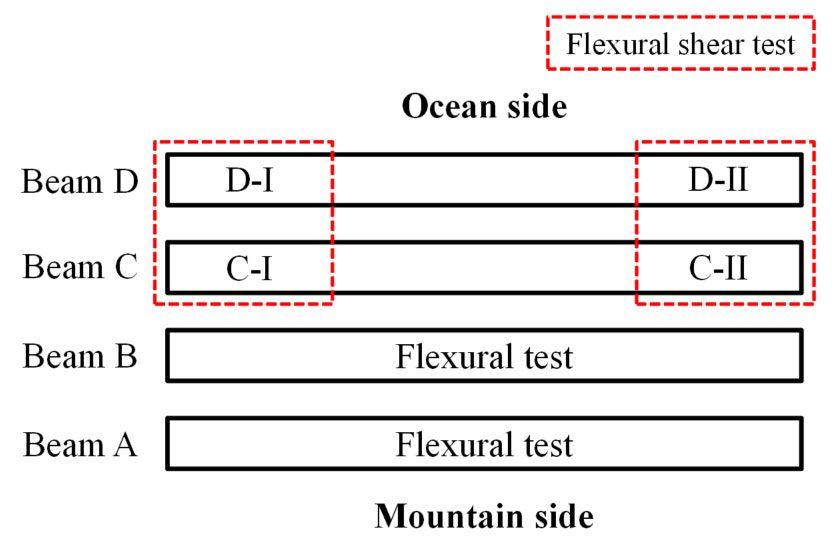
Figure 2: Loading type and original position of each girder
Table 1: Summary of results of loading tests
As the next step, we evaluated the residual strength of the girders through Finite Element (FE) analysis using the ATENA software. First, we simulated the loading tests based on the measured weight loss of the prestressing strands. The precise distribution of corrosion and the deterioration of mechanical properties in the stress-strain model used for the prestressing strands (Kuga's model) are required to predict residual strength using this method of FE analysis. It was verified that by incorporating these into the FE analysis, both failure mode and the structural performance of girders can be accurately predicted (Figures 3, 4).
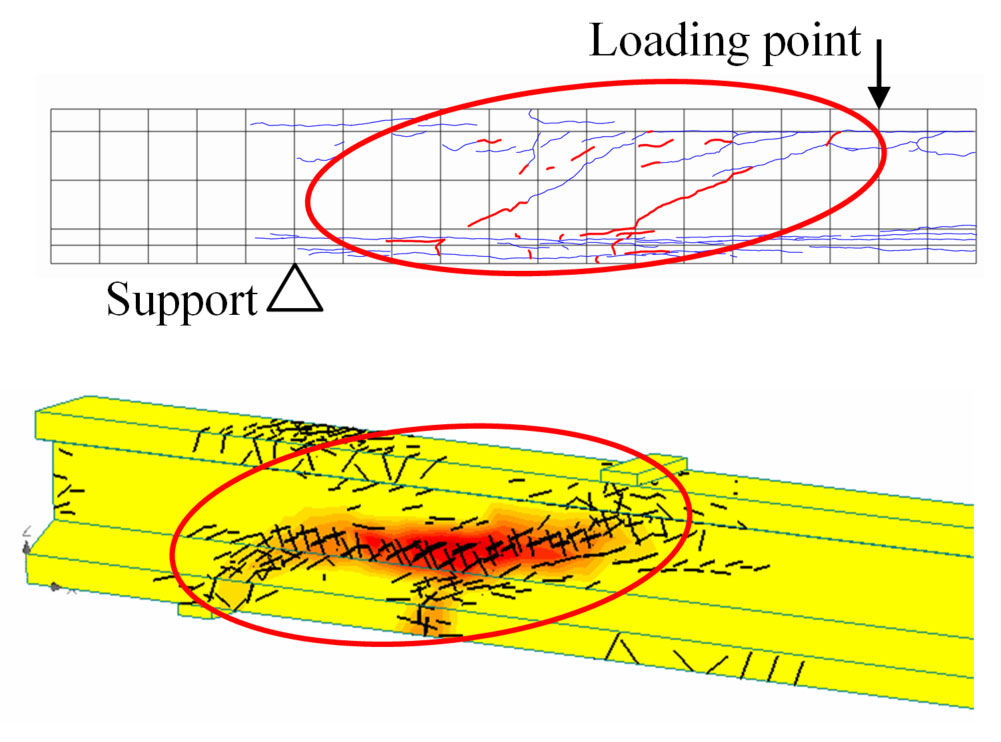
Figure 3: Comparison of crack pattern between analysis and experiment (C-II)
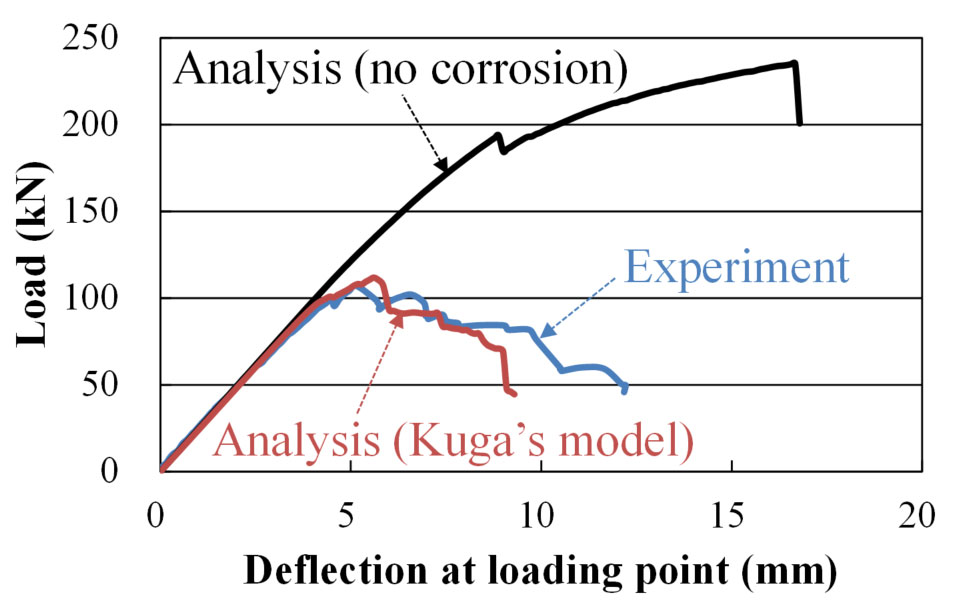
Figure 4: Comparison of load-deflection relationship
We next evaluated girder strength by focusing on the internal cracking in the girders. We assumed that a prestressing strand was completely corroded if the distance from the crack surface is less than maximum size of coarse aggregate. Locations of prestressing strand corrosion are estimated appropriately from the locations of the internal cracks. Then FE analysis based on this corrosion pattern is able to accurately estimate the residual strength of the corroded PC girder.
Thirdly, we attempted a strength evaluation with FE analysis by focusing instead on the external cracking of the PC girder. Here, we use the external cracks to predict the internal crack pattern. Then, we predicted the prestressing strand corrosion distribution as above from this internal crack pattern. The strands that remain intact were then estimated as in the earlier analysis. In this case, because the predicted locations of internal cracks are less accurate, the estimated structural performance differs somewhat from the experiments.
Finally, we compared the maximum load between analysis and experiment (Figure 5). This demonstrated that FE analysis succeeds in simulating the experimental results obtained in the loading tests if the degree of prestressing strand corrosion or the internal crack pattern of the girder are known accurately.
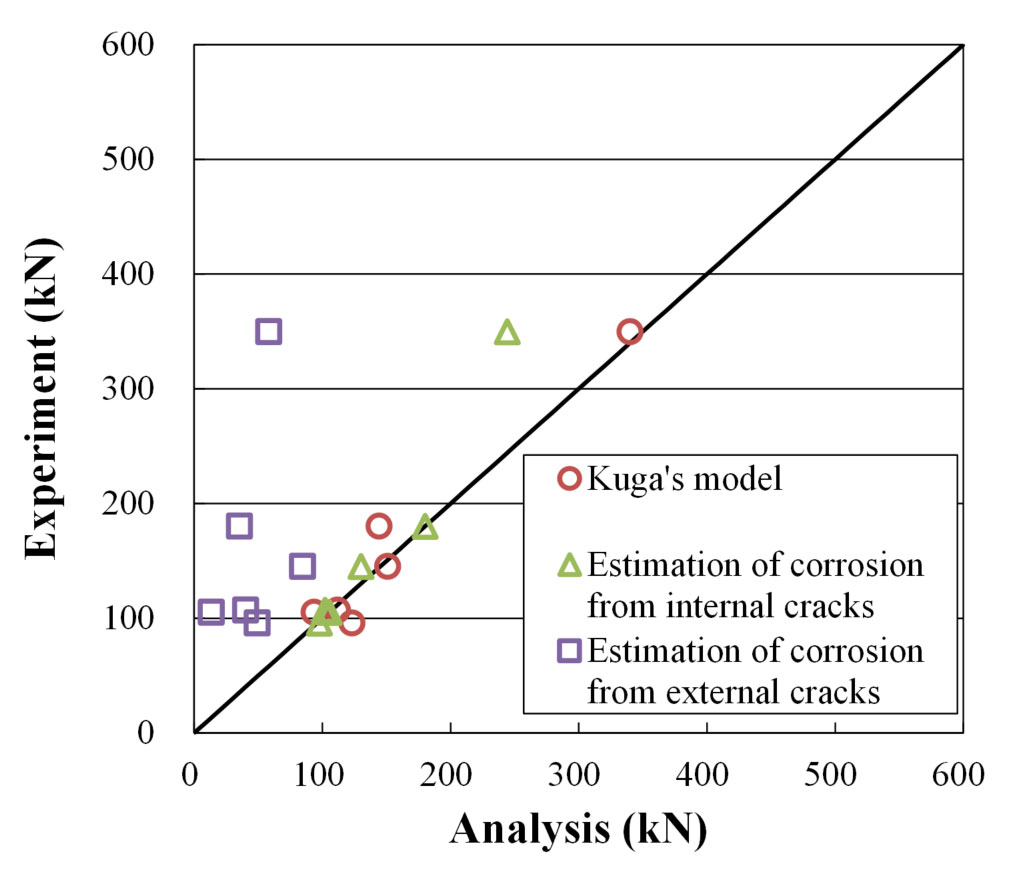
Figure 5: Comparison of maximum load between analysis and experiment
The technical understanding established in this study is applicable only to pre-tensioned PC girders with small-diameter tendons. For cases of girders with large-diameter tendons or where the tendons are post-tensioned, further studies are necessary.